|
|
About SCEC | Research | Resources | Learn & Prepare | |||||
|
Earthquake Shaking - Accounting for "Site Effects" Contents
SummaryThe most intense shaking experienced during earthquakes generally occurs near the rupturing fault, and decreases with distance away from the fault. In a single earthquake, however, the shaking at one site can easily be 10 times stronger than at another site, even when their distance from the ruptured fault is the same. Scientists have assumed that local geologic conditions are the cause of this difference in shaking intensity, but they have not been certain of the particular conditions that are most responsible, and the degree to which they affect earthquake shaking. Combining this information with estimates of where and how often earthquakes will occur would allow for better estimates of how intense shaking will be during future earthquakes. The SCEC "Phase III" Report, published in December, 2000, in BSSA, has quantified how local geologic conditions, known as "site effects," contribute to the shaking experienced in an earthquake. The study identified that the important geologic factors at a site are
By combining these factors, a map of where site effects will amplify shaking has been produced (see below). Even when these site effects are taken into account, however, each earthquake exhibits unique "hotspots" of anomalously strong shaking. Better predictions of strong ground shaking will therefore require additional geologic data and more comprehensive computer simulations of individual earthquakes. BackgroundThe ground-shaking in an earthquake depends on the magnitude, the distance from the fault and local geologic conditions. That means we can make a good guess regarding what shaking to expect at any site from a particular fault by knowing how long the fault is (this gives us the magnitude) and where it is (this gives us the distance to any site) and the geological conditions at the site. To prepare for earthquakes, we need to know how intense the shaking can be and how often we are likely to experience it. We don't need to know which fault it will come from. That's just as well because we cannot predict which fault will be active next. We do know that in the long run everywhere in southern California will experience heavy earthquake shaking.
Later in 1995, the Southern California Earthquake Center (SCEC), a consortium of universities and the U.S. Geological Survey (USGS) funded by the National Science Foundation and the USGS, commissioned a working group of more than 20 scientists and engineers to determine which areas of southern California are likely to experience amplified levels of earthquake shaking (that is, higher than other sites at the same distance from the fault rupture). The results of this study, known as the "SCEC Phase III Report" are published in a December 2000 special issue of the Bulletin of the Seismological Society of America. This report is a step towards accounting for site effects in the type of map produced in Phase II. The work to combine the Phase II and Phase III results in order to produce this comprehensive map of probable shaking is already underway. Complex Geology, Complex ShakingMost earthquake fatalities and damage occur when buildings and other structures fail during violent shaking caused by seismic waves, which travel through the ground from the rupturing fault like the ripples from a pebble dropped into a pond. The intensity of shaking depends on the quake magnitude (size of the pebble) and distance from the fault (ripples get smaller as they radiate outward). However, the radiation of seismic waves is much more complex than the steady progression of circular ripples in a pond. One reason is that the Earth's crust is not homogeneous like water, but rather a complex mixture of rocks and sediments of varying types that respond to shaking in different ways. In a single earthquake, the shaking at one site can easily be 10 times stronger than at a neighboring site, even when their distance from the ruptured fault is the same. Simple Versus Complex Earth
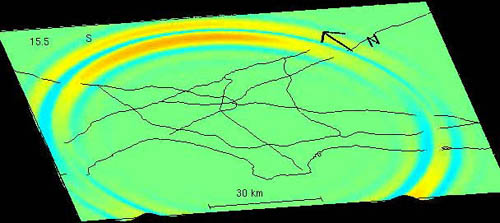
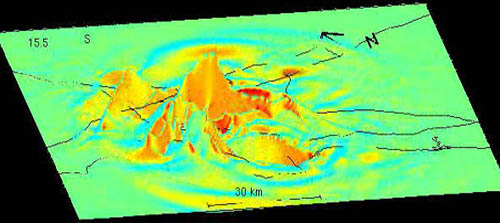
For a simple model of the Earth, shaking
is like the ripples from a pebble thrown in a pond.
The structure of the Earth beneath Los
Angeles is not simple, so the shaking is much more complex, as
indicated by this simluation of an earthquake on the Newport-Inglewood Fault. (Images courtesy of Kim Olsen, University of California, Santa Barbara.) Two Characteristics That Amplify Earthquake ShakingBy combining observations from past earthquakes with computer-based predictions, the SCEC working group quantified how levels of ground shaking in southern California are modified by various characteristics of local geology. The two found to be most important are the softness of the ground at a site and the total thickness of sediments below a site. Although scientists already knew that ground types of different softness had different levels of shaking relative to each other, the SCEC study is the first that has assigned numerical values to these effects on such a broad scale. Softness of the ground at a site- Southern California has a diverse landscape, from spectacular mountain ranges of hard, crystalline rocks to low-lying valleys filled with softer, sedimentary layers. Seismic waves travel faster through hard rocks than through softer rocks and sediments. As the waves pass from harder to softer rocks and slow down, they must get bigger in amplitude to carry the same amount of energy. Thus, shaking tends to be stronger at sites with softer surface layers, where seismic waves move more slowly. As part of an independent study published in the December 2000 report, the California Division of Mines and Geology (CDMG) created a State-wide map showing the wave speed in the shallowest 30 meters (100 feet) of the Earth's crust. The SCEC working group then verified the CDMG map for southern California by comparing and correlating these classifications with the actual shaking observed during southern California earthquakes. This calibration helped quantify the increase in shaking expected from near-surface geology in future earthquakes throughout the region. Total thickness of sediments below a site- The sediment-filled valleys of southern California, with their relatively flat terrain and fertile soil, are attractive locations for human settlement. In an earthquake, however, as the thickness of sediment increases, so too does the amount of shaking. The SCEC study developed a new map of the depth and shape of sedimentary basins in southern California and quantified the effect of basin depth on earthquake shaking. For example, shaking levels double from the edge of the Los Angeles Basin, where the sediments are thin, to the middle of the basin, where sediments reach a thickness of more than 6 kilometers (4 miles). A basin depth calculator can be used to determine this thickness under specific areas of southern California. Relative Shaking in Future Earthquakes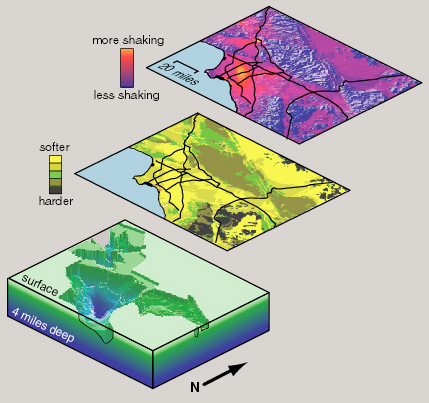
Click on each map for a larger version Two important local geologic factors that affect the level of shaking experienced in earthquakes are (1) the softness of the surface rocks and (2) the thickness of surface sediments. In these images of the Los Angeles Basin, the lowest layer shows the depth of sedimentary basins, and the middle layer shows the softness of near-surface rocks and sediments (by "softness" we really mean the speed at which shear waves travel in the upper 100 feet of a site. ) The top layer combines this information to predict the total amplification expected in future earthquakes from local geologic conditions or "site effects." The orange areas are the "hotspots" where this amplification (not shaking) is anticipated to be highest. Shaking will ususally be most intense near the rupturing fault in an earthqauke. Areas of intense shaking due to proximity to probable earthquakes were mapped in the SCEC Phase II Report. Data for images courtesy of Harold Magistrale, San Diego State University; Chris Wills, California Division of Mines and Geology; and Ned Field, U.S. Geological Survey. Pattern of Shaking Varies From Earthquake to EarthquakeThe two characteristics identified in the SCEC study can explain some, but not all, of the variations in earthquake shaking at specific sites. Preliminary computer simulations of how seismic waves travel outward from fault ruptures (see images below) indicate that there will be "hotspots" of anomalous shaking unique to each earthquake. These hotspots depend on specific details of the earthquake, such as orientation of the fault, irregularities of the rupturing fault surface, and scattering of waves as they bounce off subsurface structures. Useful prediction of these effects will require more comprehensive computer simulations of potential earthquakes on a case-by-case basis. This is the goal of a concerted, interdisciplinary effort by SCEC and USGS scientists. The USGS and CDMG, working with SCEC researchers, are producing practical tools that earthquake engineers, insurance companies, and emergency-management officials can use to prepare for the shaking-amplification patterns identified in the new SCEC report. These tools will not only help to save lives and protect property in future quakes in southern California but will also help to improve understanding of seismic hazards in other earthquake-prone regions of the United States. A Tale of Two Earthquakes
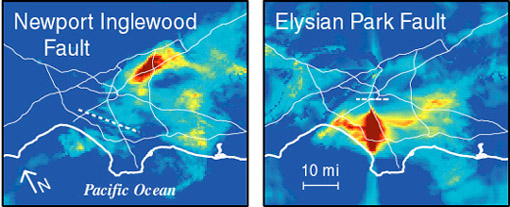
These images of the Los Angeles Basin show "hotspots" predicted from computer simulations of an earthquake on the Elysian Park Fault and an earthquake on the Newport-Inglewood Fault (represented by the white dashed lines). What is shown is not how much shaking was experienced at a particular site but rather how much more or less shaking (highest levels are shown in red) a site receives relative to what is expected from only the magnitude of the earthquake and the site's distance from the fault. These images consider only part of the total shaking (long-period motions) and were calculated by using a simplified geologic structure. (Data for images courtesy of Kim Olsen, University of California, Santa Barbara.) Cooperating Organizations
|
|||||||||


|
Created in the SCEC |
|
© 2026 Privacy Policy and Accessibility Policy |